YouTube Trending Video Analysis and Prediction
Introduction
YouTube has been a source of entertainment for viewers and income for content creators since it’s conception in 2005. And while the viewers can simply sit back and enjoy the videos, the content creators have to put time into researching how to make the best video so that they can achieve maximum views and make themselves the most revenue. But the problem is the “best” videos aren’t made from some simple y=x formula, it can take things like click-bait titles and over-the-top thumbnails to get people interested as soon as they see the notification. As the amount of time spent on the internet increases (especially in times of quarantine), exploring YouTube and it’s algorithms is a very alluring field for data scientists and researchers alike. Thus, looking into how videos in the past have performed and what the top videos have in common is a great way to try to flesh out at least some variables in the formula to make great videos. Taking a deep dive into variables such as the like ratio, title, or time of posting, we hope to find out how to make a succesful video. Using the dataset of thousands of succesful YouTube videos, we would like to predict the outcome of videos based on a number of different fields, which hopefully is important for content creators as it could help them be more succesful and increase their YouTube revenue.
Data
We chose to the use the dataset Trending YouTube Video Statistics from Kaggle. This dataset contains information about all of the videos that hit the trending page in the US from November 2017 to March 2018. This totals to 40950 entries. It has 16 features for each video, such as the title, date of posting, view count, video category, like count, and dislike count. This meant that the dataset has numerous types of features. Since our main goal was to predict the view count of a video using regression, we decided to focus on the numerical features rather than the categorical or text-based features. However, we did also perform some analysis of the dataset as a whole, and of the text-based features specifically. We chose to focus on using only the like and dislike counts as predictors of view count, because they are very strong indicators of community engagement that are available on nearly every video on YouTube. In our dataset, only 169 entries did not have ratings enabled.
Approach
The techniques that we used for exploring and studying our dataset of Trending YouTube Video Statistics are divided into two parts.
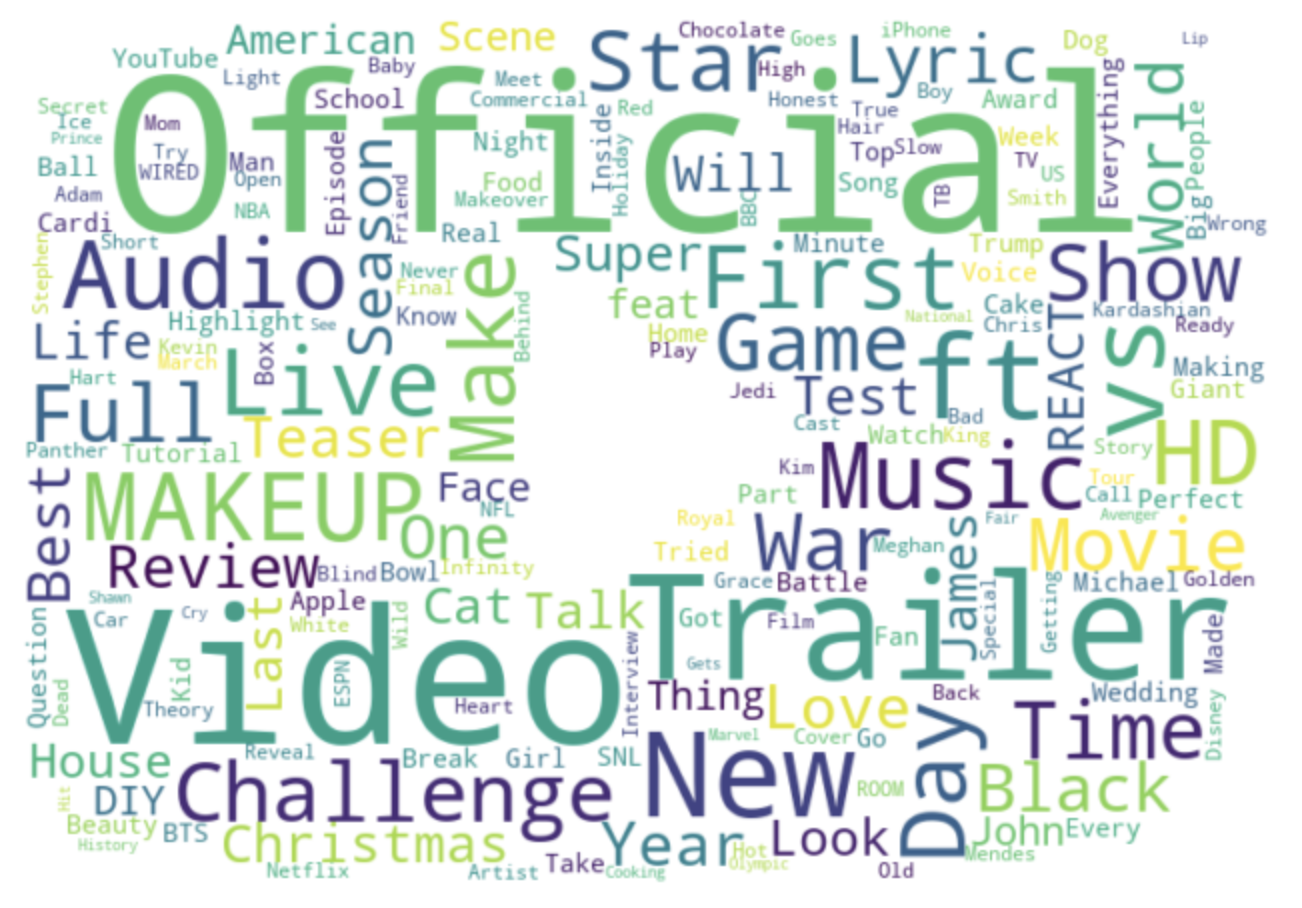
In the first part we perform some convincing and resourceful semantic analysis on our dataset. This means that we use the data itself and only the data to relate it to itself and therefore be able to catch some trends between the different features presented in our dataset. These semantic analysis resulted in some convincing visuals that are presented in the section below. The first technique used for semantic analysis was determining the correlation between the present features of the YouTube videos of the dataset. Using the found correlations we created a heatmap to create a more convincing visual and to be able to draw some conclusions. We also created a Word-Cloud of the most commonly present phrases/words in the title of the trending YouTube videos present in our dataset (the technique used takes care of not including the common STOPWORDS such the English language prepositions, i.e. ‘of’, ‘the’, etc.).
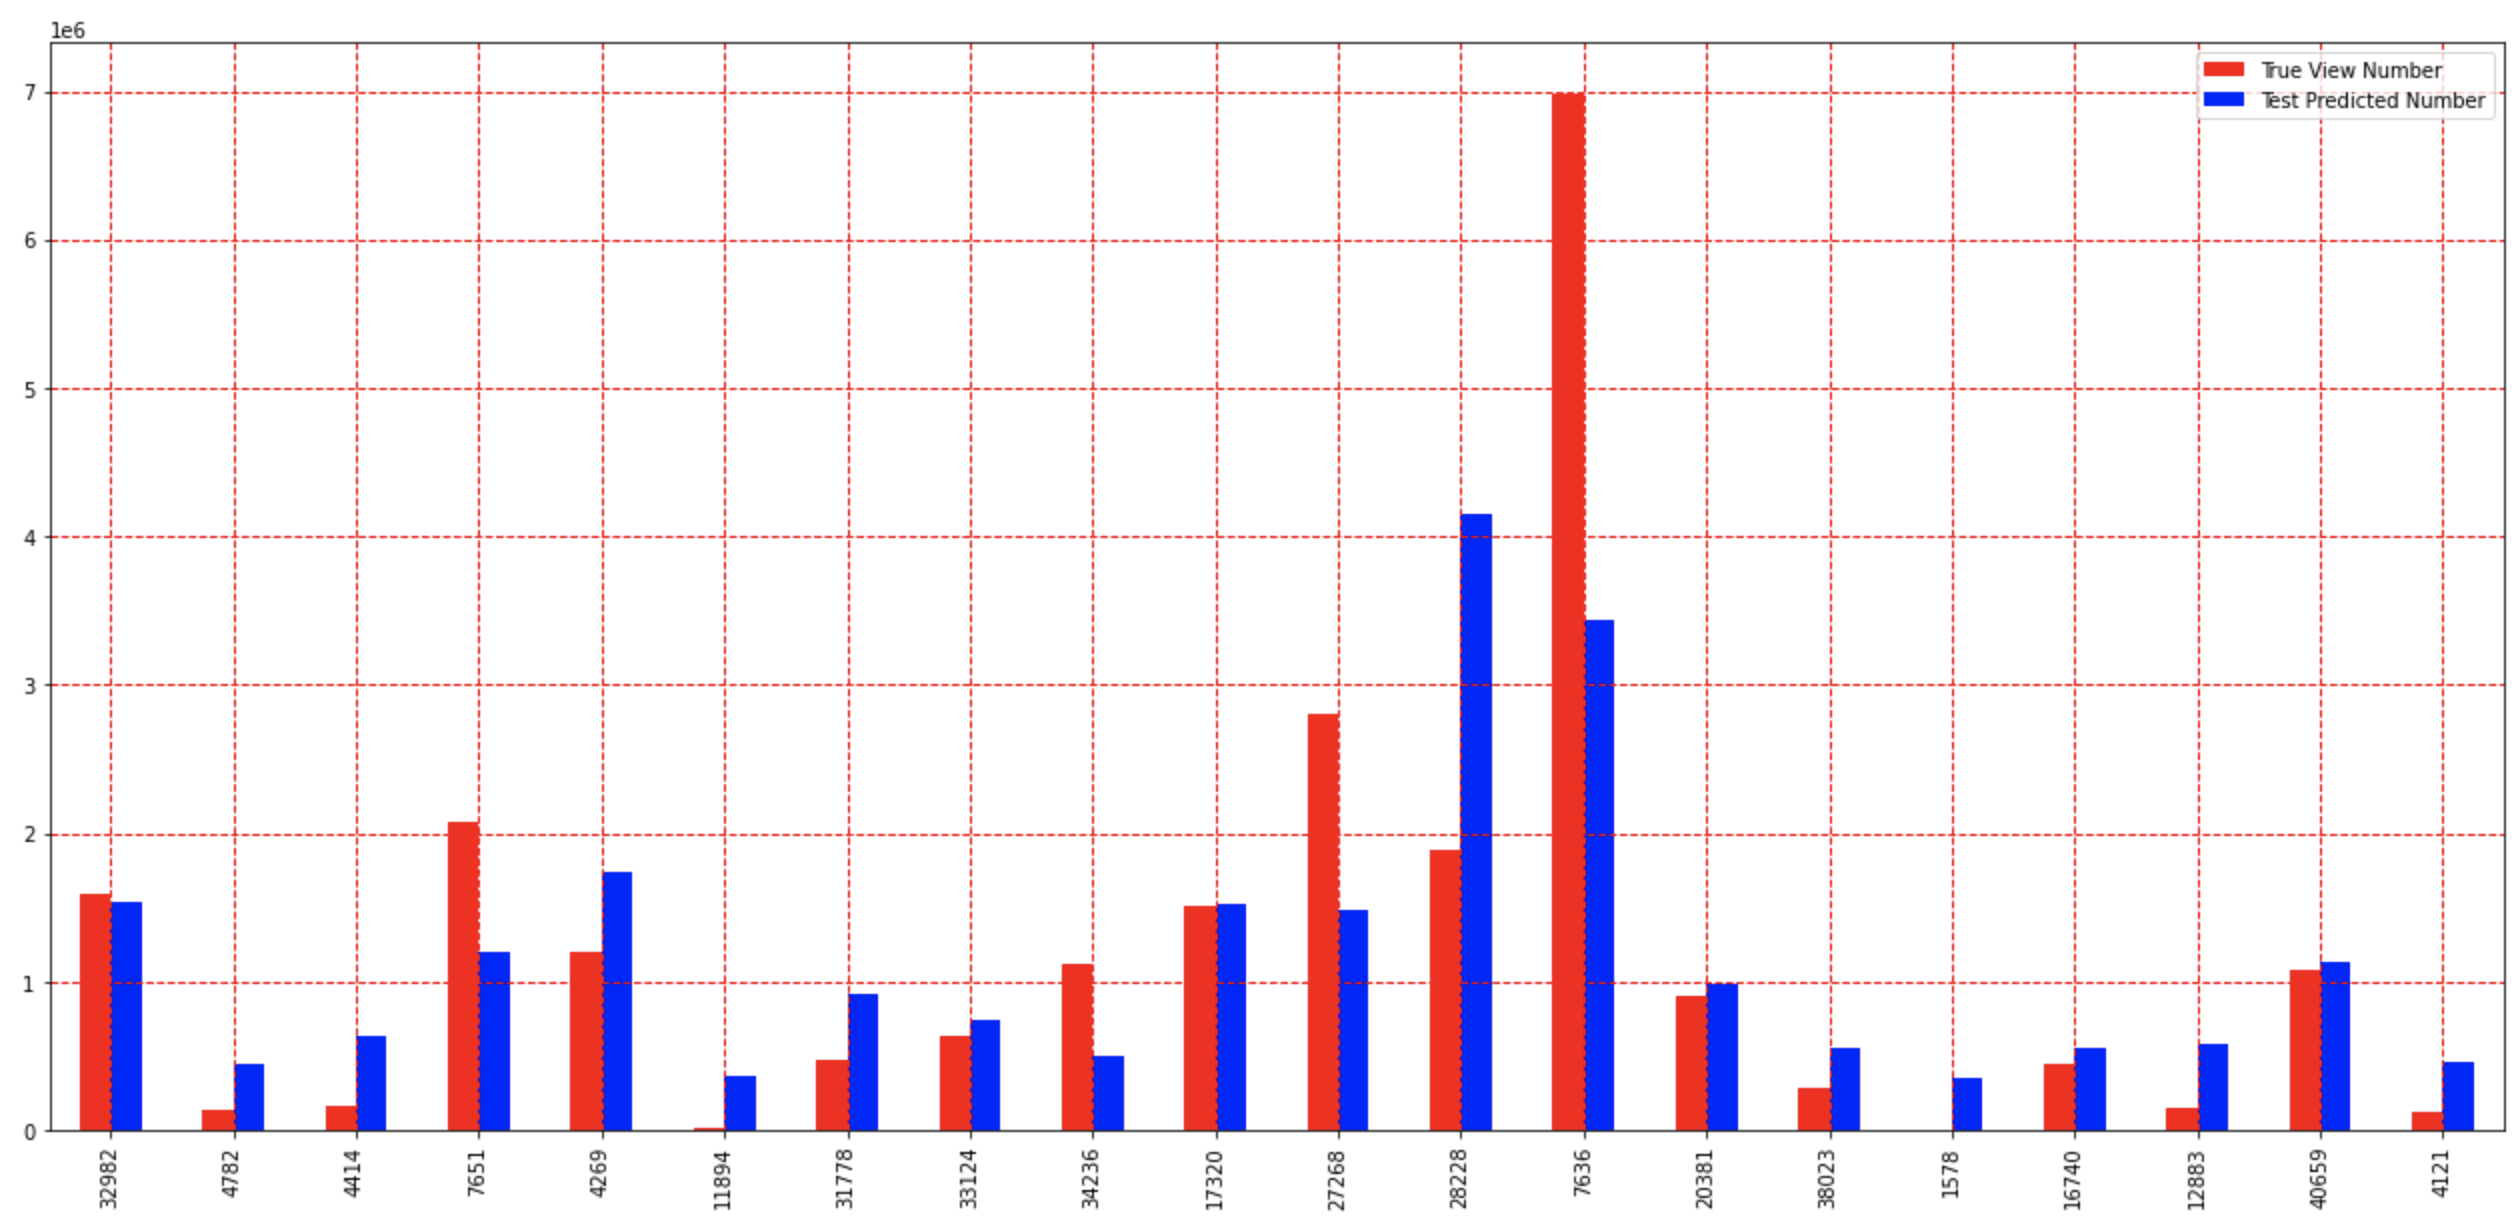
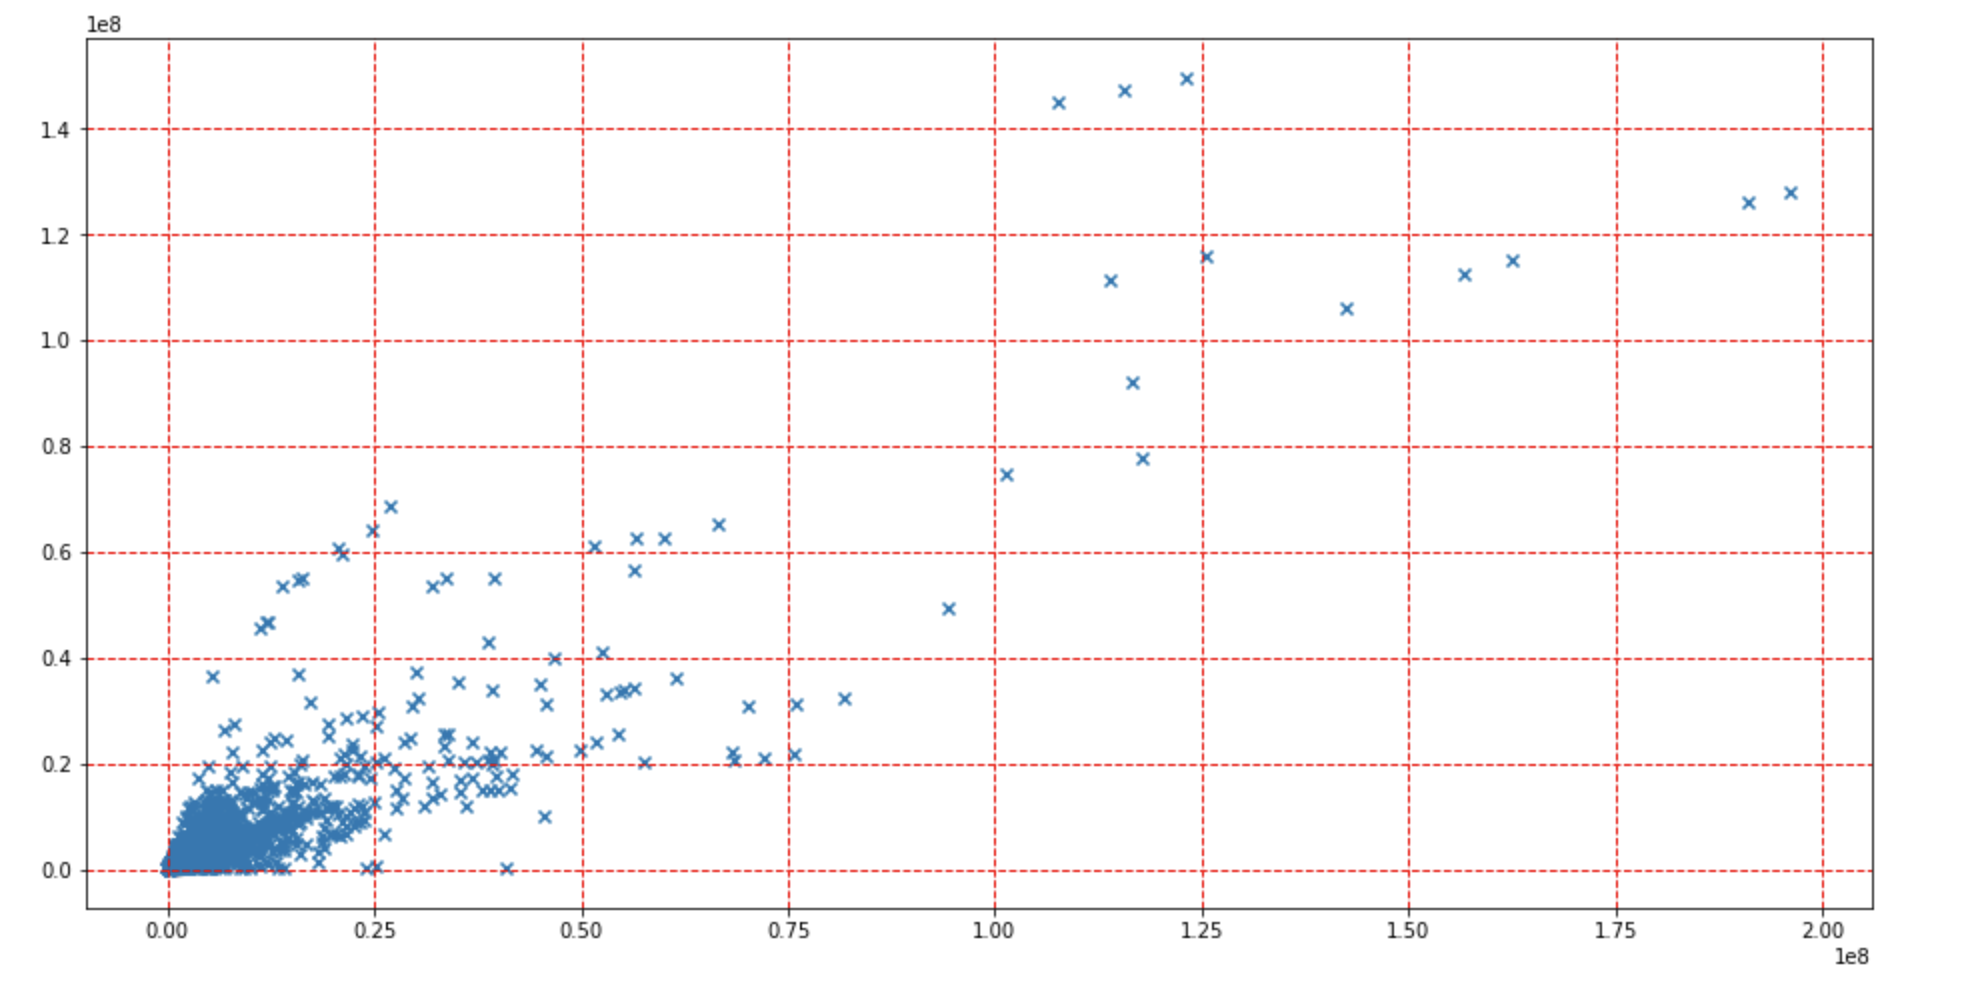
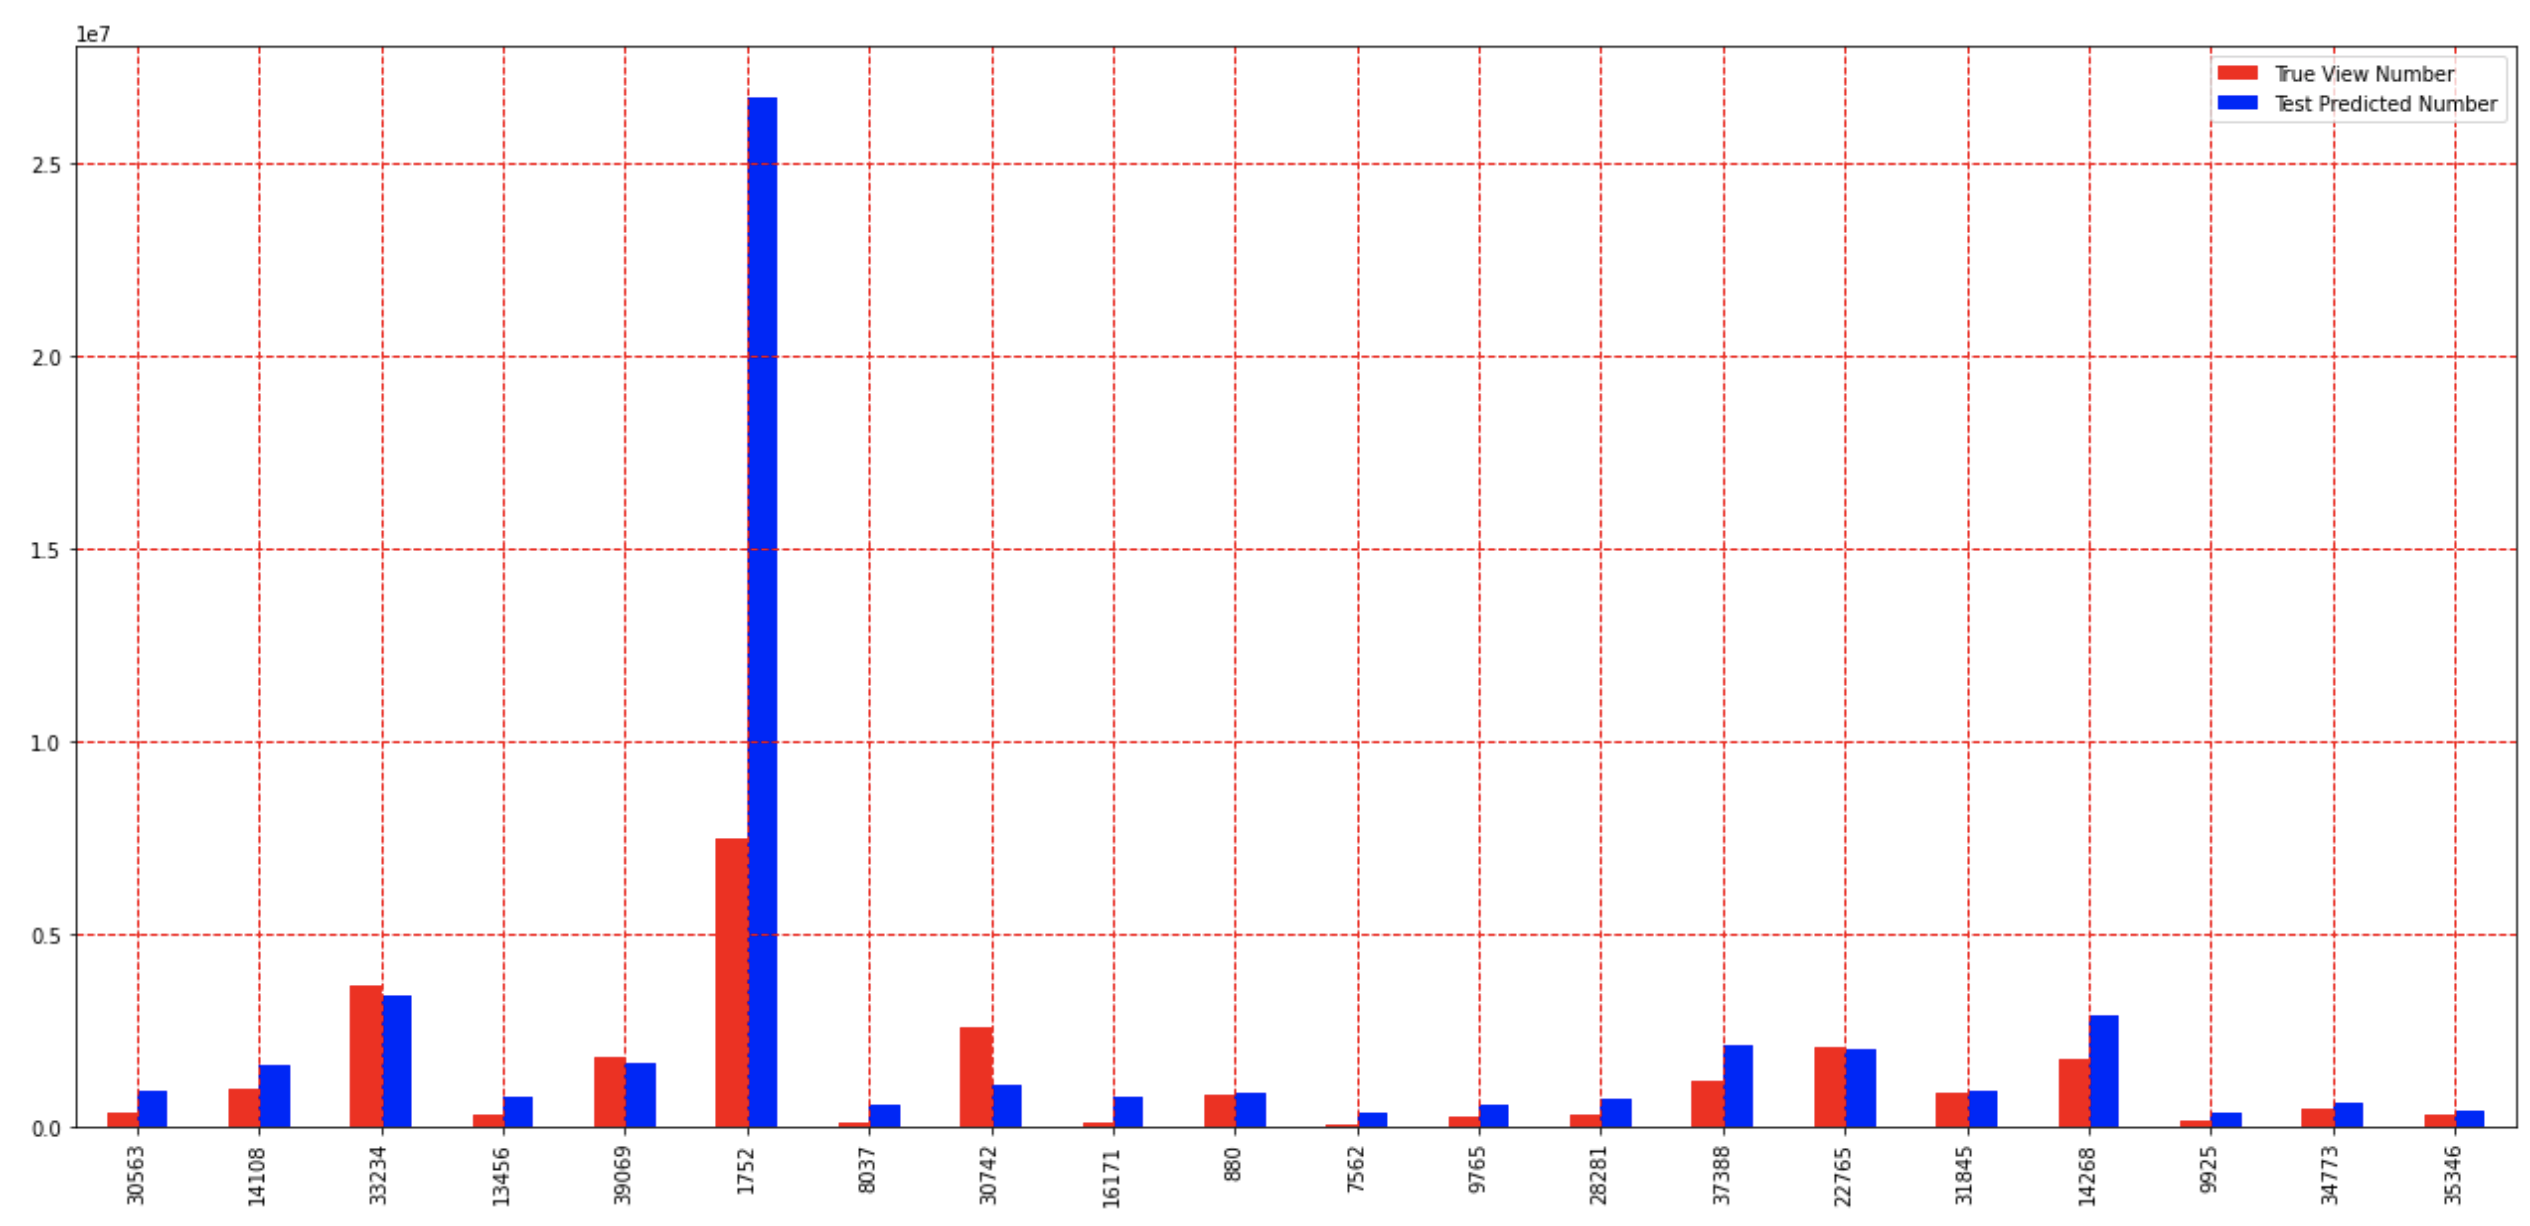
In the next part of the techniques we implemented for studying out dataset, we strive to use the Supervised learning method of Linear and Ridge Regression to create a model that seeks to predict the ‘views’ count of a trending YouTube video based on it’s number of ‘likes’ and ‘dislikes’ features, as present in the dataset. To do so we created a Linear Regression and a Ridge Regression model using 85% of our data as training data and 15% of our data as test data. The predictors used in both our Linear and Ridge Regression predictive models are the number of ‘likes’ and ‘dislikes’ of the trending YouTube video, and the variable being predicted is the number of views for the trending YouTube video. After creating the model we ran the test portion of our data on our created models, and visualized the prediction outcomes for both of our models in the form of bar graphs that compared and contrasted the true views count vs the predicted views count for a 20 member sample of test trending YoutTube videos. After that we also decided to visualize the outcome of the Linear Regression model as a scatter plot that plotted true views count of the test YouTube videos vs their predicted views count by the linear regression model. This scatter plot is a great visual on top of the contrasting bar graphs to gauge the accuracy of the Linear Regression model in predicting the number of views count for a test YouTube video based on its number of ‘likes’ and ‘dislikes’ features. It’s possible to see and observe the general trend and regression line that the scattered data points are following in the scatter plot.
In the next section you’re presented with the outcomes and results of the techniques we used in exploring and studying our dataset.
Results and Discussion
Data Visualization and Analysis
Table of Feature Correlations
 After cleaning the raw dataset, the selected features were correlated with each other to find any interesting connections. The most obvious features of a popular video, views, comments, likes/dislikes, all had significant correlations with each other. The Comments disabled and Ratings disabled features also had a small, but non-zero correlation. The last insight was with Category ID. Views and Likes both had a small, 0.17, correlation with it.
Heatmap of Correlations
 This heatmap takes the correlations from the table of correlations and highlights a positive correlation by darkening. Negative and near 0 correlations are light blue and darken as they get stronger. Ignoring self-correlation, likes dislikes, comments and views all have decent correlations with each other, ranging between 0.4 and 0.8. Most of the others are near 0 except for Comments Disabled and Ratings Disabled with 0.32. While not entirely conclusive, it can be noted that more likes, dislikes, and comments are correlated with more views. More views means more revenue from the video, and so even if a video is extremely disliked and has a lot of comments about how bad/awful it is, it will still generate a lot of money.
Title Word Cloud

This word cloud was constructed using data from titles of each trending video. The most popular choices (i.e. Official and Video) are the largest and smaller the less common they are. Some interesting popular titles include: “MAKEUP”, “Trailer”, “Challenge”, “New”, and “ft.” (featuring), suggesting basing videos around these titles/ideas would help make videos more popular
Regression Prediction

Linear Regression - Bar Graph

Using Linear Regression with the dataset, a view count in hundreds of thousands of views was predicted with each of the testing set videos. Predicted views are shown in blue and true views in red. More than half the time, 13 of 20 of the shown results, the predicted views were roughly 1/2 to 2x the number of true views
Linear Regression - Scatter Plot

Using the same linear regression model as the bar graph, more testing data was used to show predicted vs actual view counts in tens of millions of views. The x-coordinate was the predicted view count and the y-coordinate was the actual. Although not prefect, a correlation can be seen between the model-based prediciton and actual views.
Ridge Regression

The dataset was modeled again using Ridge Regression this time. Views, in tens of millions, were predicted as indicated by the blue bar and true views were shown by the red bar. A times the model closely predicted true views, but sometime was off to by up to 4x, shown by the largest blue bar. However the prediction was often within ½ - 2x the actual number.
Conclusion
Our project leveraged several different supervised learning techniques to predict trending Youtube video view count. The linear/ridge regression, using only 2 features, and the random nature of view counts have certainly proved to have limited our accuracy, but nonetheless it’s enough to predict the relative trend of certain video’s view count in respect to some threshold, which may be enough for the video creators as they only need to know a minimum view count to better predict their pays.
Future work
Without question, our methodology can be improved. Although we had access to 40,000+ rows of data, access to more data/features would make our model more robust. With more data and using more than just the like/unlike features may help our model learn and hence improve the overall accuracy. Also, implementing similar predictions using deep learning neural networks may improve the results as well. Another approach is possibly to split data into chunks of video categories and to calculate within those chunks can be integrated into our approach, which may lead to more accurate predictions as the viewers of each video category may differ in behavior.